BAA Photometry Database Guide to Creating Light Curves and Tables of
Observations
Contents
How
to Create a Light Curve or Table of Observations
Recalculation
of Visual Observations using the Latest Sequence
How
to Create a Light Curve or Table of
Observations
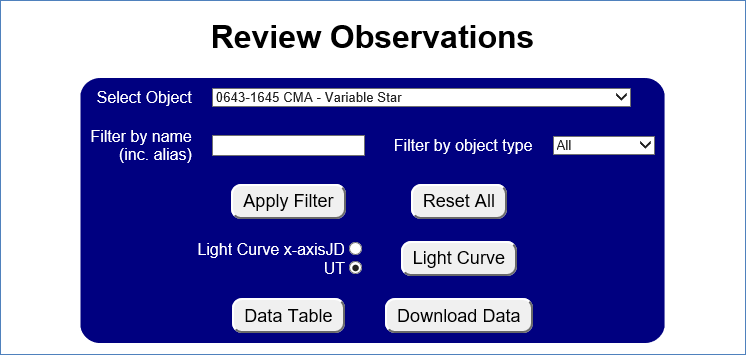
1. Select an object.
· You can search for an object by typing text into the “Filter by name” box and then pressing “Apply Filter”.
o This will also search alternative designations which are not in the main list!
· You can limit the list by selecting an Object Type of Variable Star, Exoplanet or Asteroid and pressing “Apply Filter”.
2. Press a button to create a Light Curve, Data Table or to Download Data.
· You can zoom in to the Light Curve with your mouse.
· The downloaded data is a csv (comma separated values) file copy of the data table.
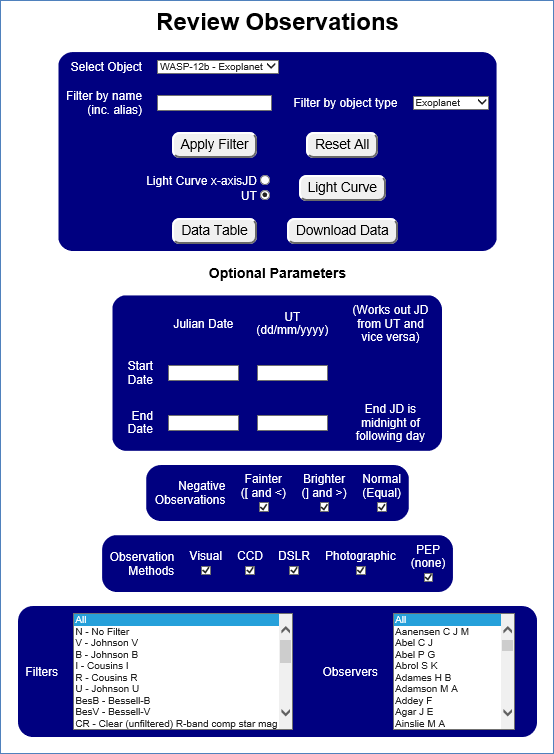
Optional Parameters
· Change the y-axis of the Light Curve between JD and UT using the radio button.
· A date range can be entered in JD or UT. It will automatically convert between them!
· You can remove negative observations, fainter than and brighter than, by unticking these check boxes.
· Deselect any “Observation Methods” which are not required.
· Select “All” or 1 or more filters from the list. (Press and hold the control key to select multiple filters.)
· Select “All”, or 1 or more observers from the list. (Press and hold the control key to select multiple observers.
Recalculation of Visual Observations using the Latest Sequence
At the bottom of the Review Observations screen are options for recalculating the visual observations to the latest sequence. This means that where possible the Light Curve will show the magnitude recalculated from the original light estimate using the latest sequence, rather than the original observer magnitude. Example light estimates are “B(2)v(1)C “, “=E” and “86-1”, where B, C, E and 86 refer to stars in the sequence/chart. This is useful for variable stars with a long history of visual data, since the very original comparison star magnitudes from the early charts will be far less accurate than the magnitudes for the same stars using modern photometry.
This is made possible as the BAAVSS sequences/charts (and a few others) have been loaded into the database. A comparison star is identified from the original chart and light estimate reported by the observer. The comparison star is then mapped across to the latest sequence to obtain a more accurate magnitude. These updated comparison star magnitudes are then used to recalculate the magnitude of the variable star using the light estimate.
It should be noted that recalculation is only enabled for visual observations. It is not enabled for digital observations made by CCDs and DSLRs as there are other complications which could result in a lower quality derived magnitude.
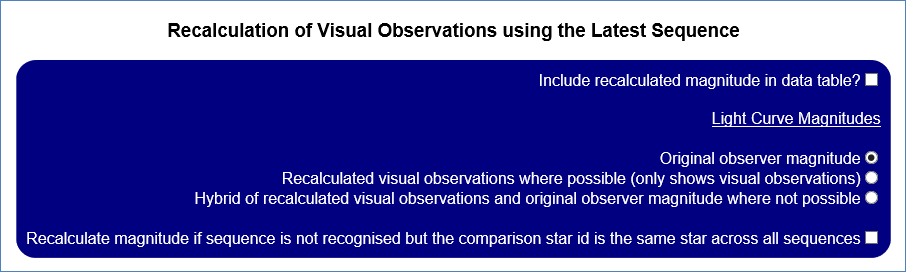
Here is an explanation of the options.
Data Table
· Include recalculated magnitude in data table?
o This adds additional columns to the displayed and output data tables for the recalculated magnitude and a comment explaining why the magnitude could not be recalculated where it is not possible.
Light Curve
Magnitudes
· Original observer magnitude
o This is the default setting and simply shows the Light Curve using the original observer magnitude.
· Recalculated visual observations where possible (only shows visual observations)
o This only shows visual observations in the Light Curve and only those observations where recalculation is possible. This will often create a cleaner looking Light Curve as it won’t be confused by observations where the magnitude could not be recalculated to the latest sequence.
· Hybrid of recalculated visual observations and original observer magnitude where not possible
o This shows all observations as either the recalculated magnitude and otherwise the original observer magnitude.
Sequence Not
Recognised
· Recalculate magnitude if sequence is not recognised but the comparison star id is the same star across all sequences
o While every effort has been made to include all historic sequences in the database to enable the recalculation of magnitudes, sometimes there will be sequences which are not in the database. Normally in this scenario the magnitude is not recalculated as it is not possible to match the original comparison stars to the latest sequence. This option will recalculate the magnitude in this scenario if the comparison star id is the same across all sequences. For example if comparison star “E” always refers to the same star in all sequences.
Zooming in on a Light Curve
You can zoom in to a Light Curve with your mouse.
1. Highlight a rectangle with your mouse.
2. The Light Curve will change to a zoomed in view of just this rectangle.
3. Repeat as many times as you like to zoom in further.
4. Press the reset zoom button to reset the Light Curve.